The Pit and The Pendulum Project
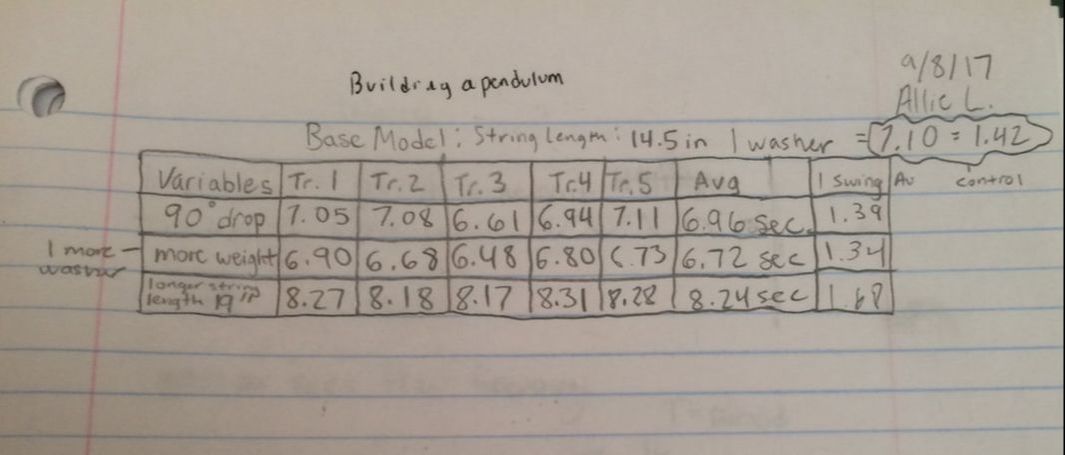
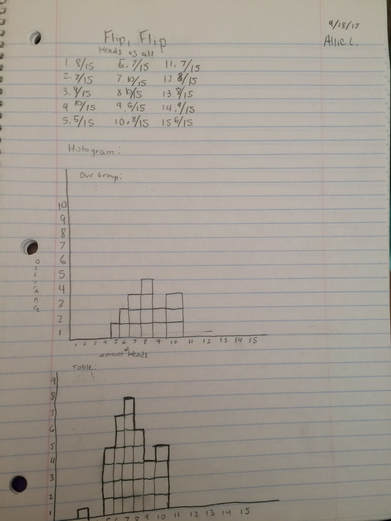
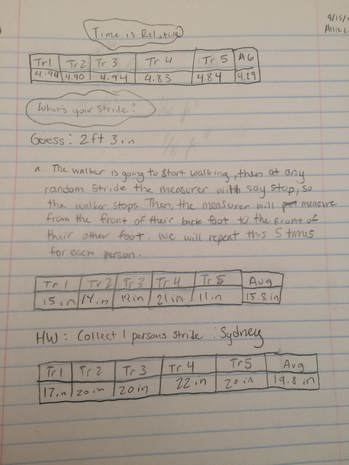
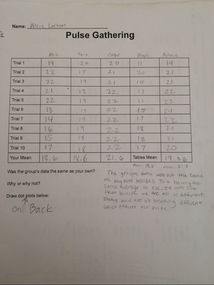
For this project, we started out by reading the Pit and the Pendulum by Edgar Allan Poe and created a drawing that represented the book. Next, we analyzed the pendulum And all aspects of where they were so we could go on to decide if he could have really escaped. Then, we made our own pendulums with a partner with washers and string. We change different aspects of the pendulum such as degree of drop, amount of weight, and the length of the string. This helped come up with the conclusion that the only thing that changes the amount of time that it takes for the pendulum to swing is the string length. With this information we went on to learn how to analyze data and find standard deviation. Then we came back to the pendulum, and in the classroom we took pendulums from one foot to 8 feet tall and timed how long it took for them to swing. By finding the means of how long each swing is for each length of pendulum we could then plot it and draw our estimated line all the way up to 30 feet. We been got our estimates and then swung 830 foot quote pendulum off of the roof of our school. We then got to see how close are estimate was to the actual time of a swing of a 30-foot pendulum. I learned a lot about analyzing data and using standard deviation to find how accurate your data is. Some of my work throughout this project will be shown below.
For this project, we started out by reading the Pit and the Pendulum by Edgar Allan Poe and created a drawing that represented the book. Next, we analyzed the pendulum And all aspects of where they were so we could go on to decide if he could have really escaped. Then, we made our own pendulums with a partner with washers and string. We change different aspects of the pendulum such as degree of drop, amount of weight, and the length of the string. This helped come up with the conclusion that the only thing that changes the amount of time that it takes for the pendulum to swing is the string length. With this information we went on to learn how to analyze data and find standard deviation. Then we came back to the pendulum, and in the classroom we took pendulums from one foot to 8 feet tall and timed how long it took for them to swing. By finding the means of how long each swing is for each length of pendulum we could then plot it and draw our estimated line all the way up to 30 feet. We been got our estimates and then swung 830 foot quote pendulum off of the roof of our school. We then got to see how close are estimate was to the actual time of a swing of a 30-foot pendulum. I learned a lot about analyzing data and using standard deviation to find how accurate your data is. Some of my work throughout this project will be shown below.
|
|
